
See what your project data is telling you.
SpecSense is designed to make the information teams already enter useful beyond one drawing or PDF through Project Reports, dashboard summaries, proposal activity, and geographic views.
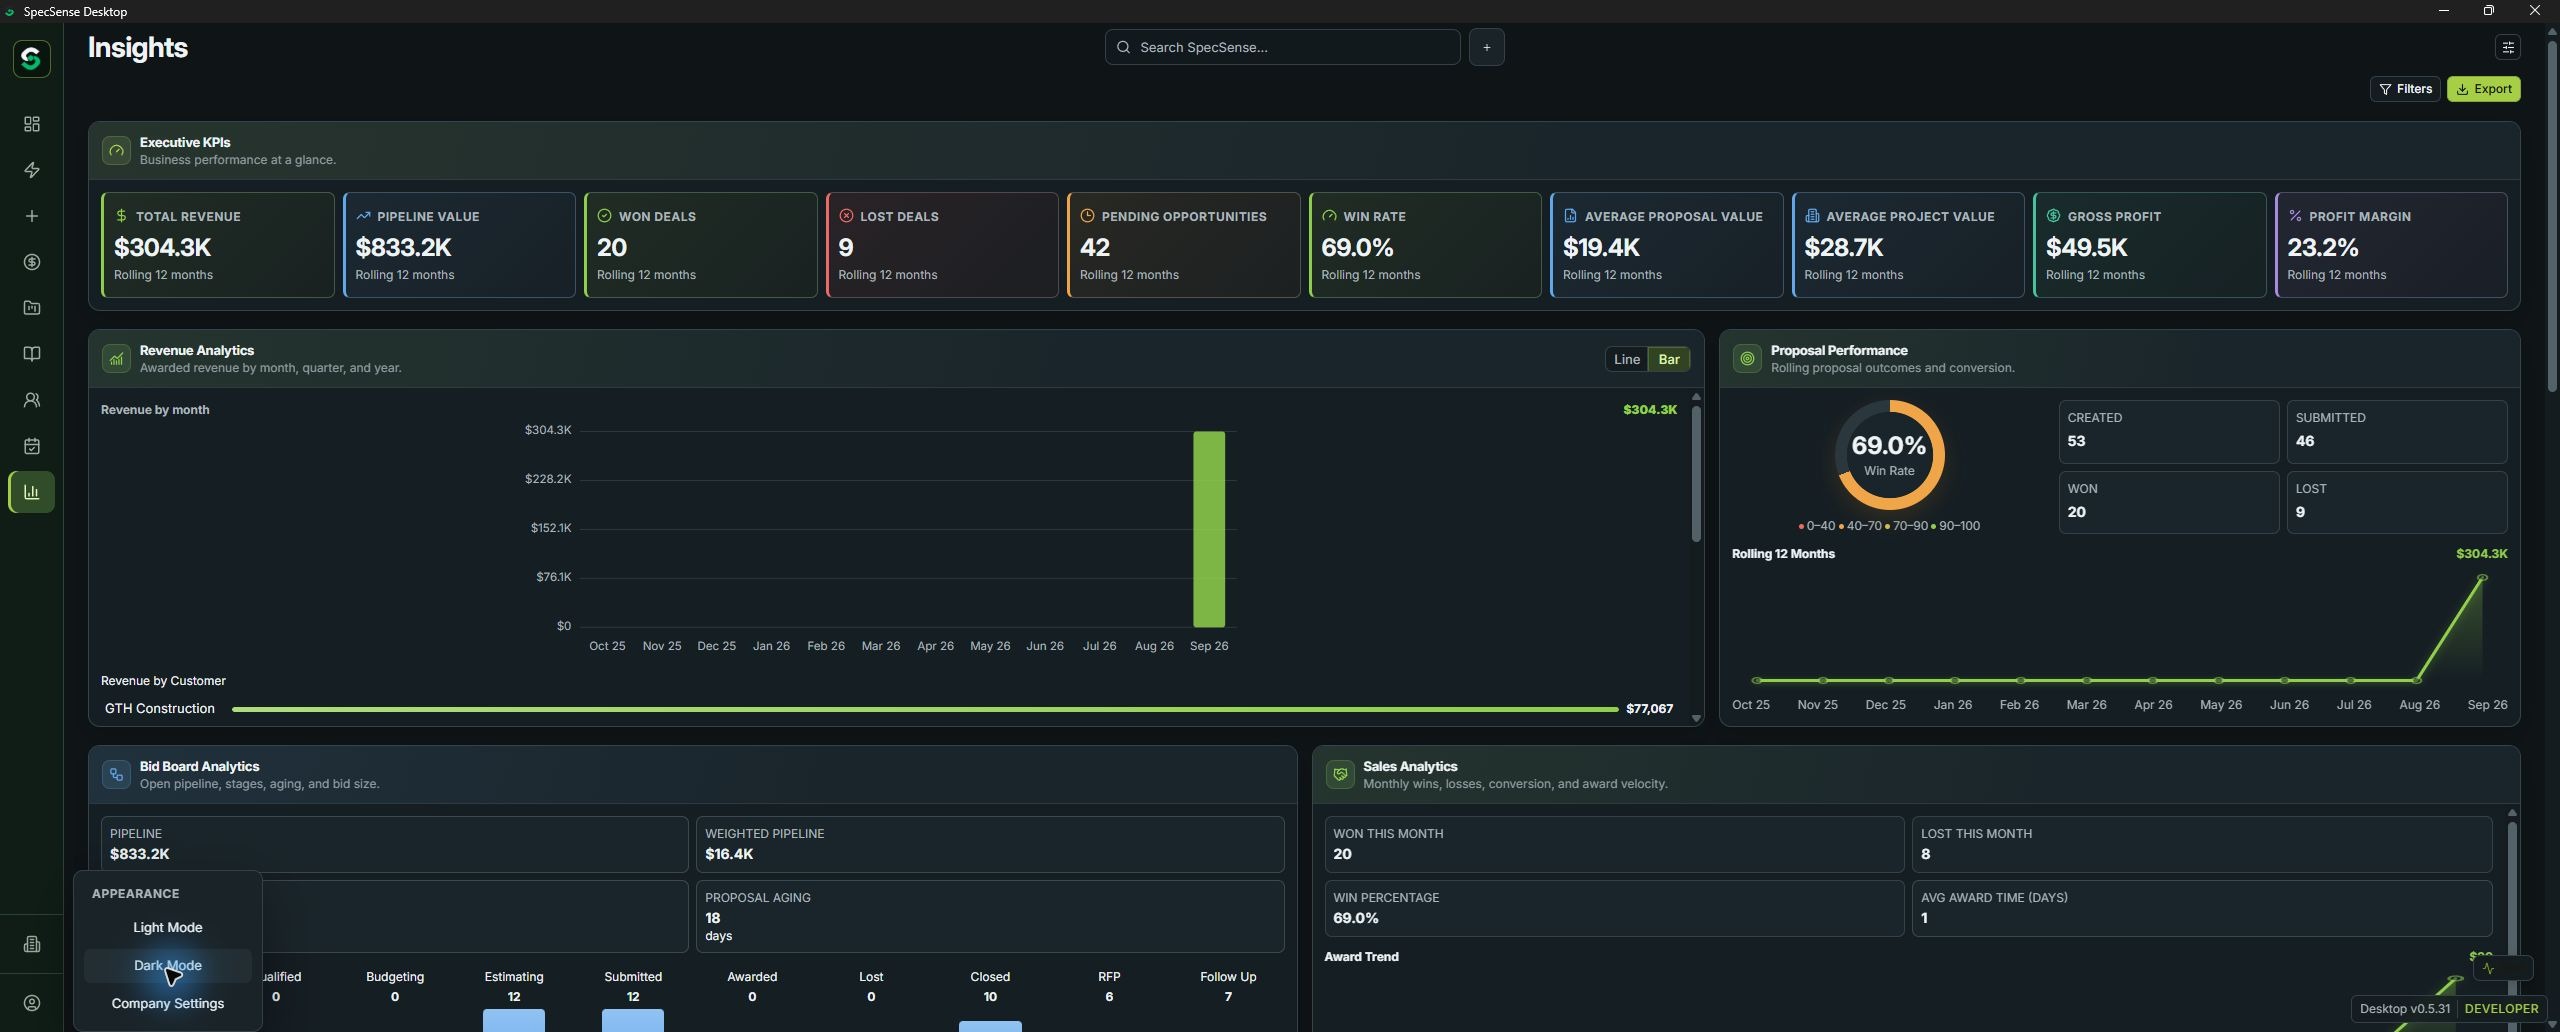
- 01Project reports
- 02Dashboard activity
- 03Proposal outcomes
- 04Geographic views
Views reflect the project data your team maintains.
Report the project clearly
Organize scope, quantities, notes, source context, BOM information, and supporting project details for review and handoff.
Understand activity over time
Dashboard views can connect active work, proposals, awarded/lost outcomes, workload, and project status without inventing generic business metrics.
See geographic concentration
The Project Heat Map is designed to show mapped project and opportunity activity. It does not claim market forecasting or guaranteed opportunity intelligence.
Explore how it applies to your work.
You have seen how the core SpecSense workflow connects. Now explore how it applies to the systems you design and estimate.
Explore Solutions Or help shape what comes next in the Beta →